Office
837 N 34th St Ste 100
Seattle, WA 98103
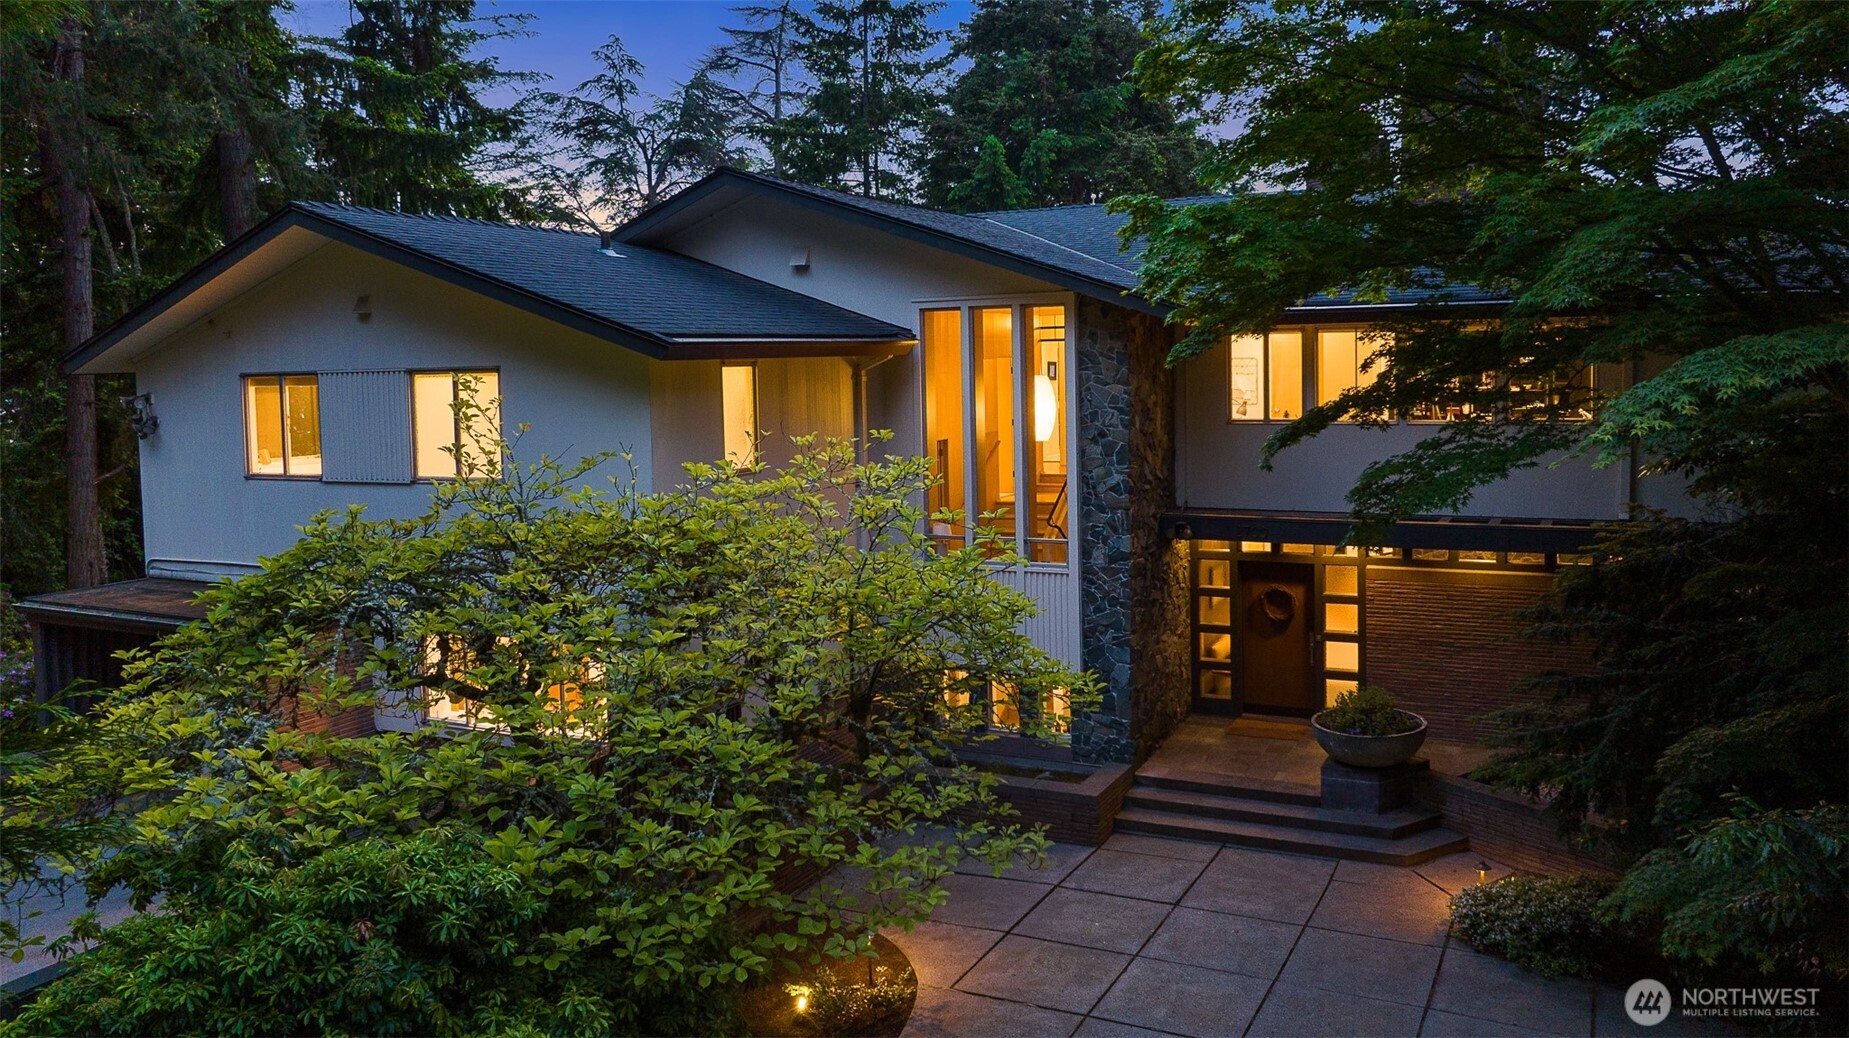
2700 SW 156th Street, Burien, WA 98166
Provided by NWMLS, Marketplace Sotheby's Intl Rty
Provided by NWMLS, Marketplace Sotheby's Intl Rty
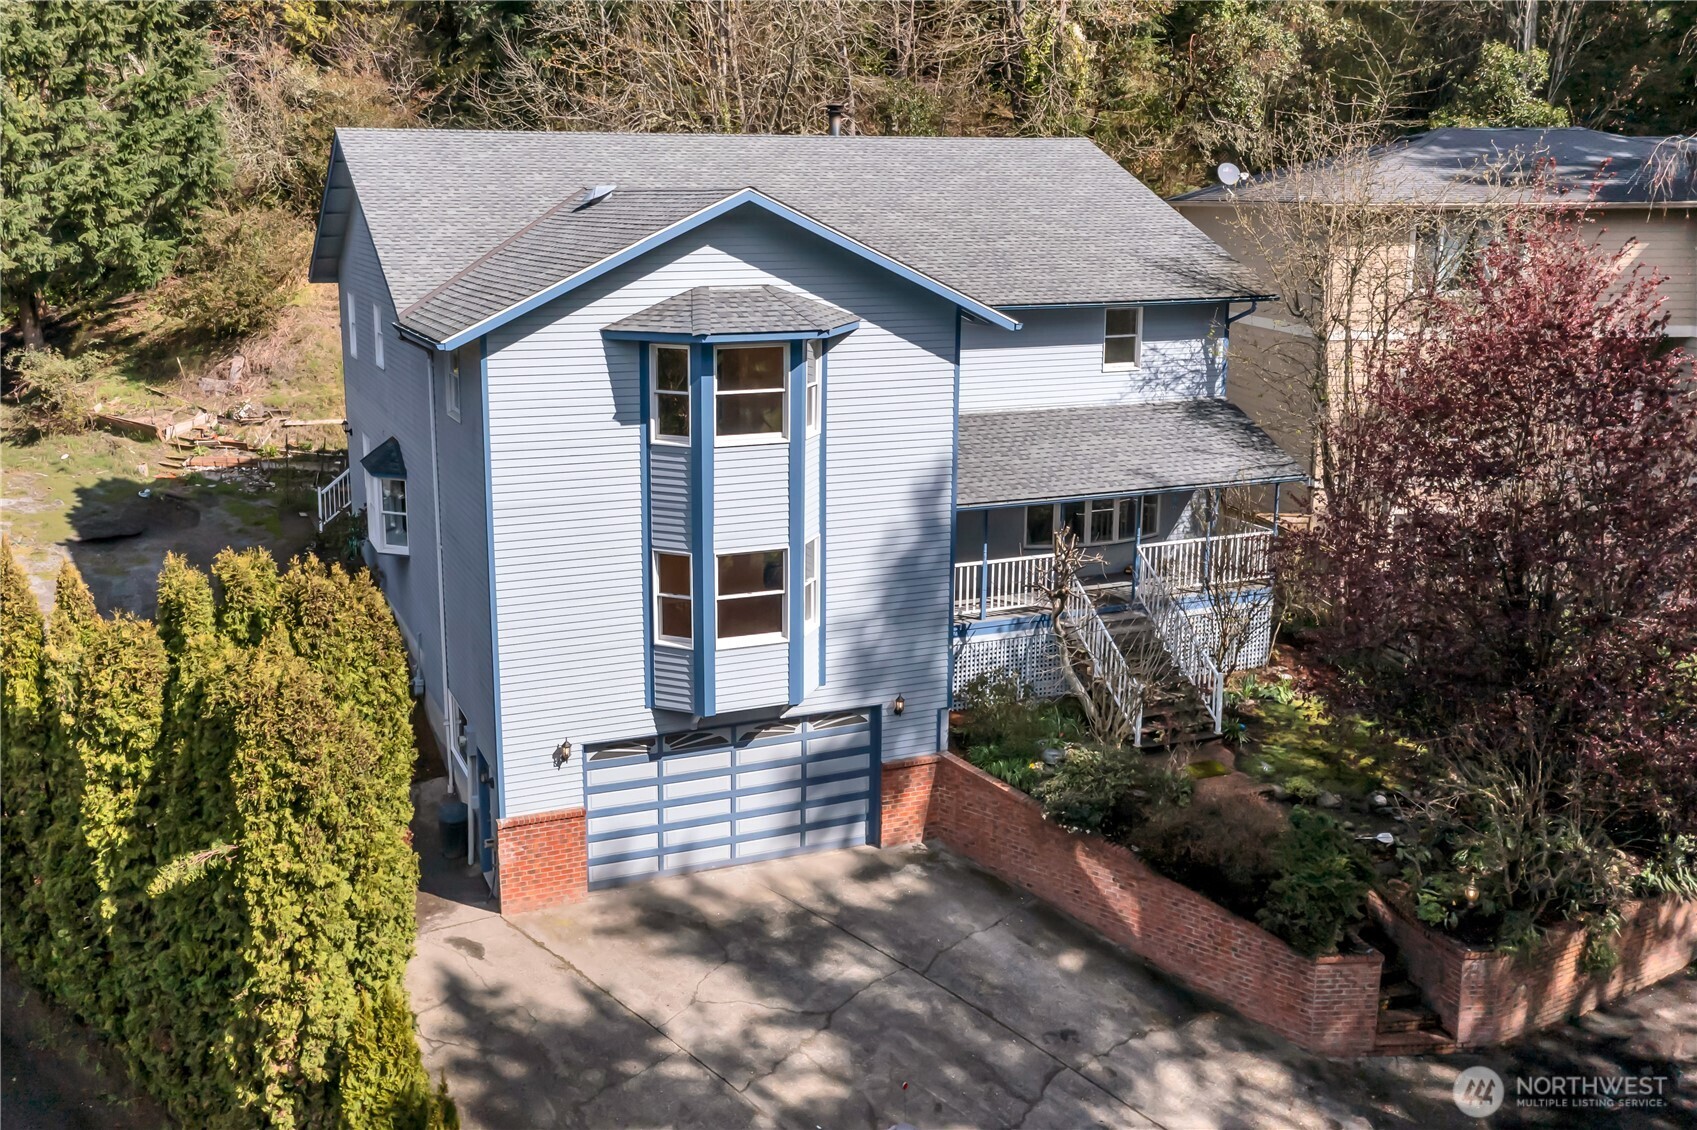
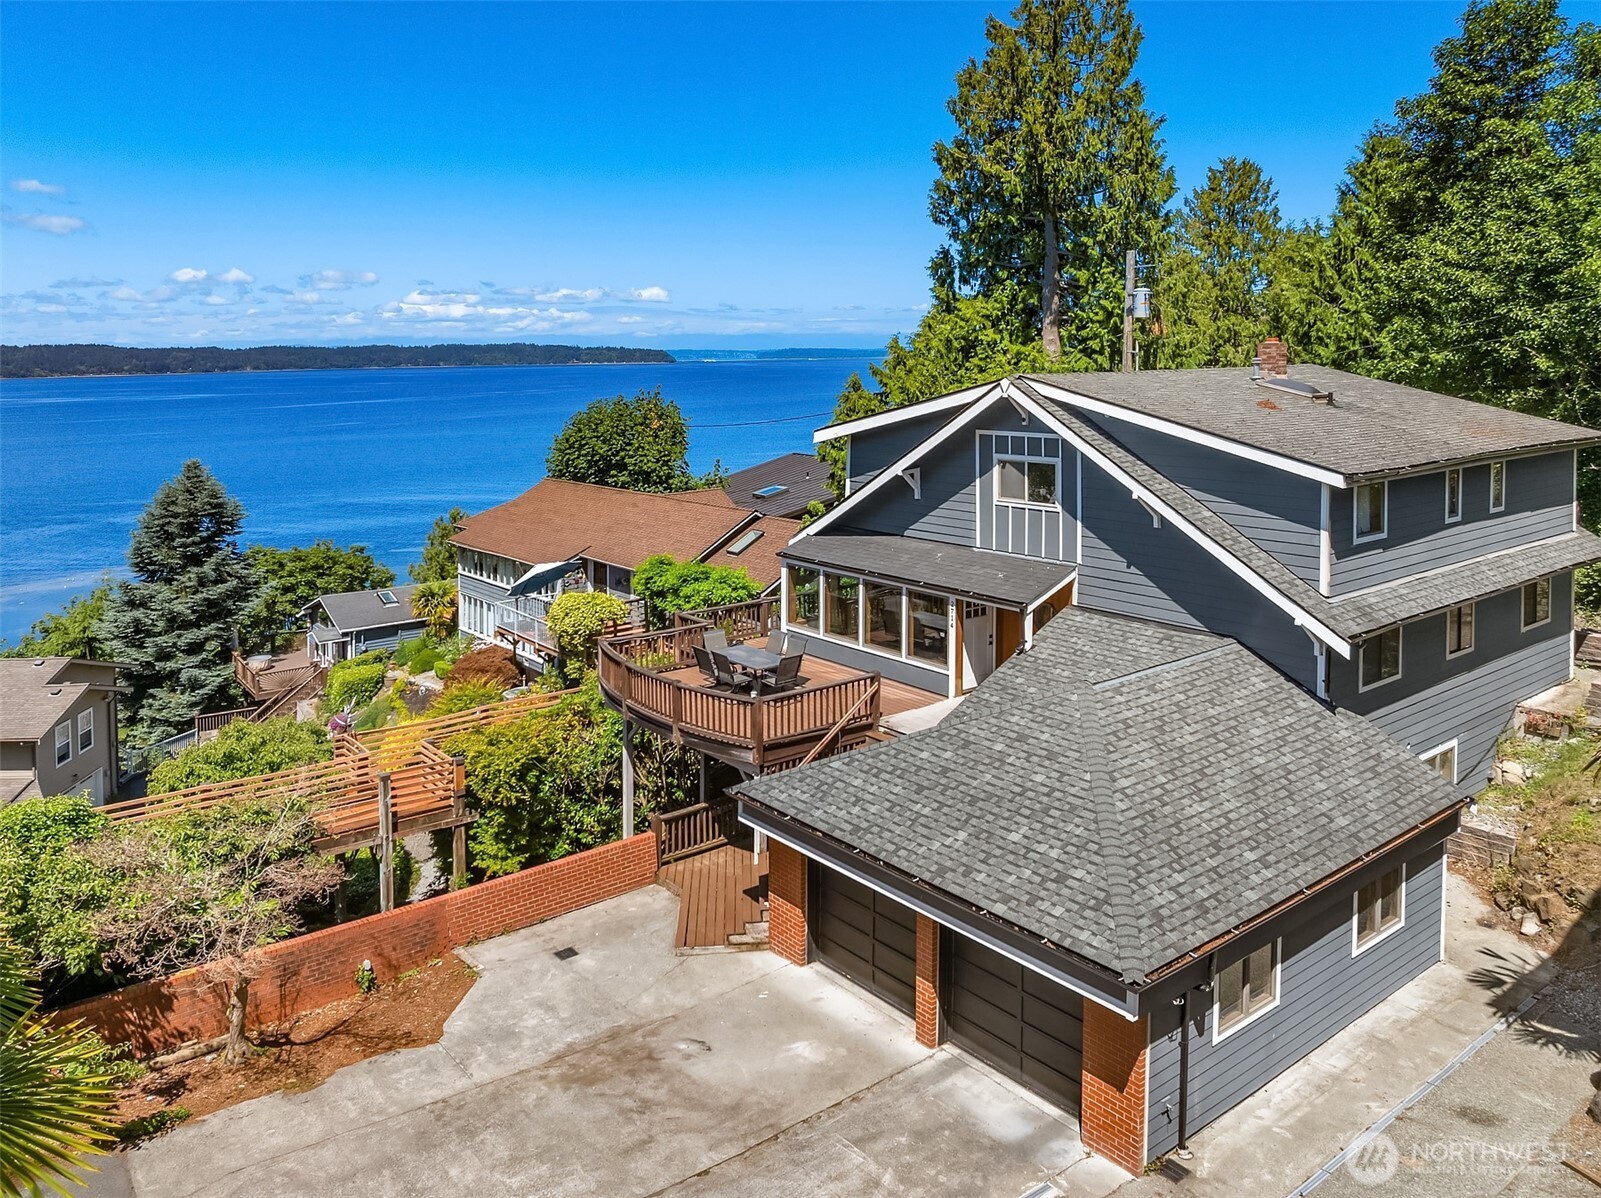
1622 SW 140th Street, Burien, WA 98166
Provided by NWMLS, John L. Scott, Inc.
Provided by NWMLS, John L. Scott, Inc.
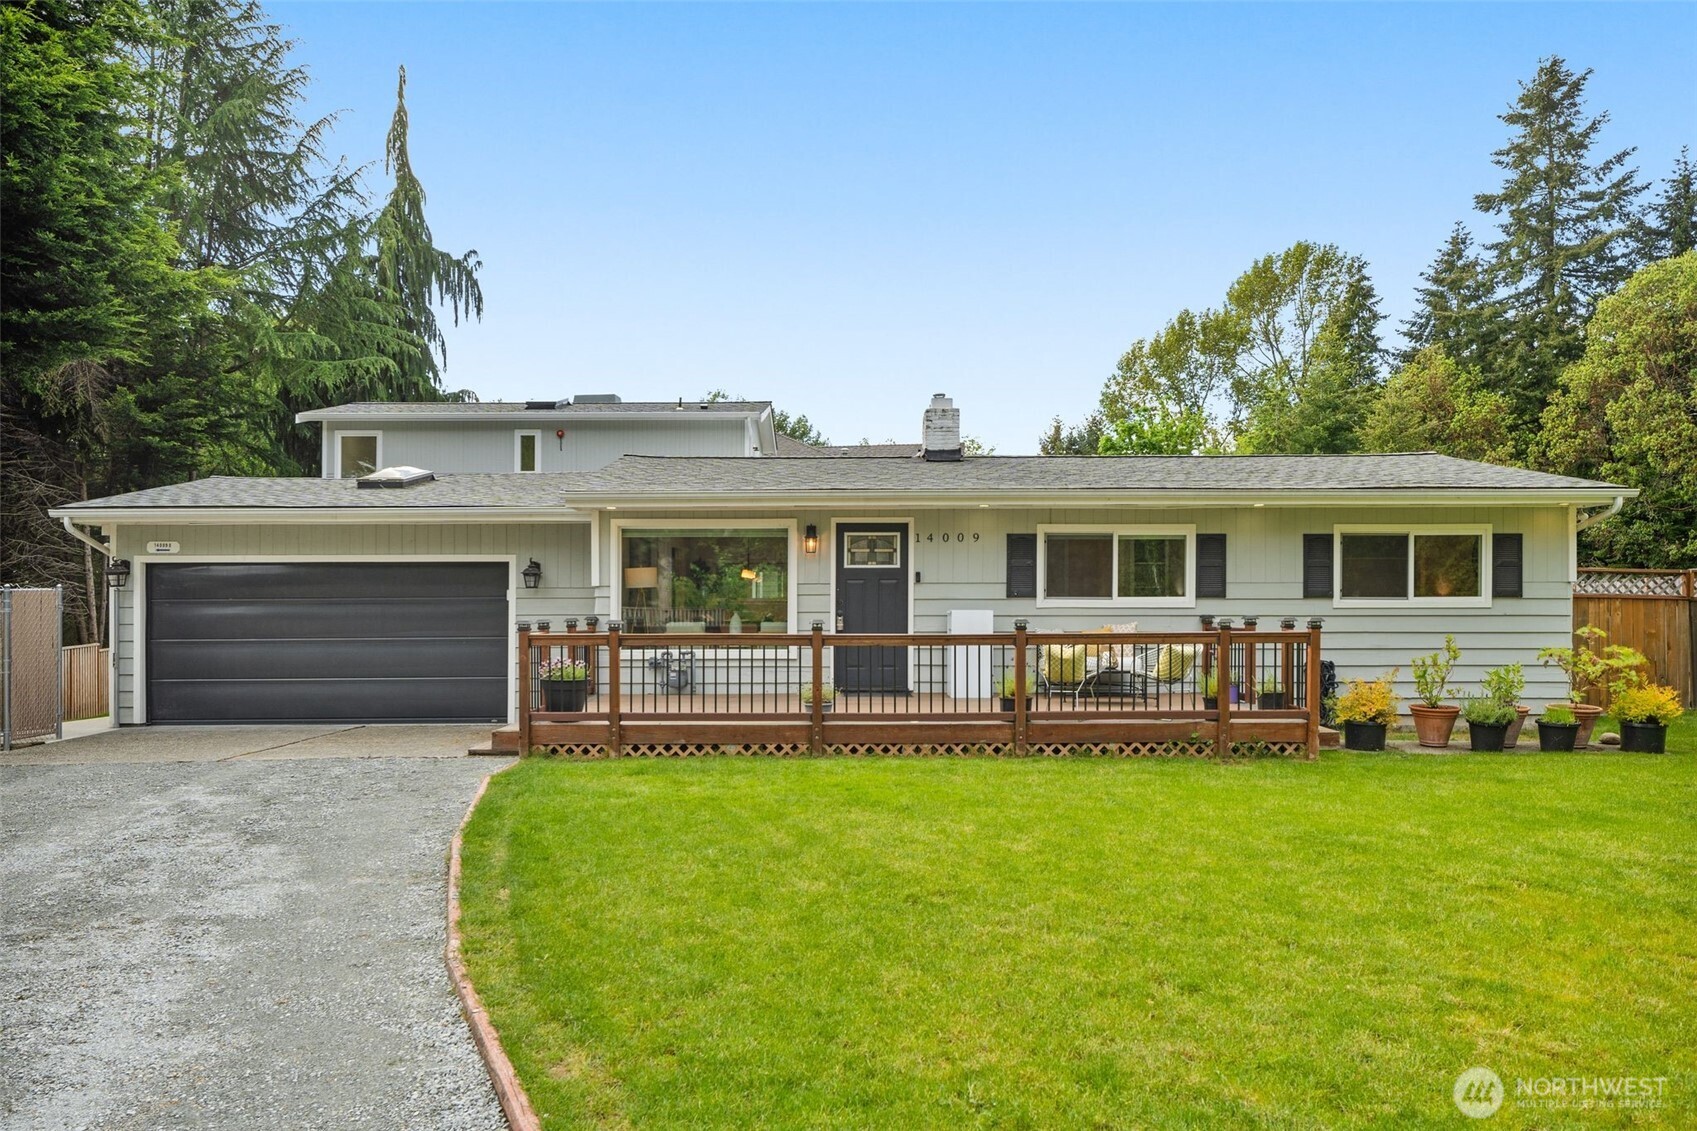
14009 13th Avenue SW, Burien, WA 98166
Provided by NWMLS, SCOUT
Provided by NWMLS, SCOUT
2714 SW 152nd Pl, Burien, WA 98166
Provided by NWMLS, John L. Scott, Inc.
Provided by NWMLS, John L. Scott, Inc.
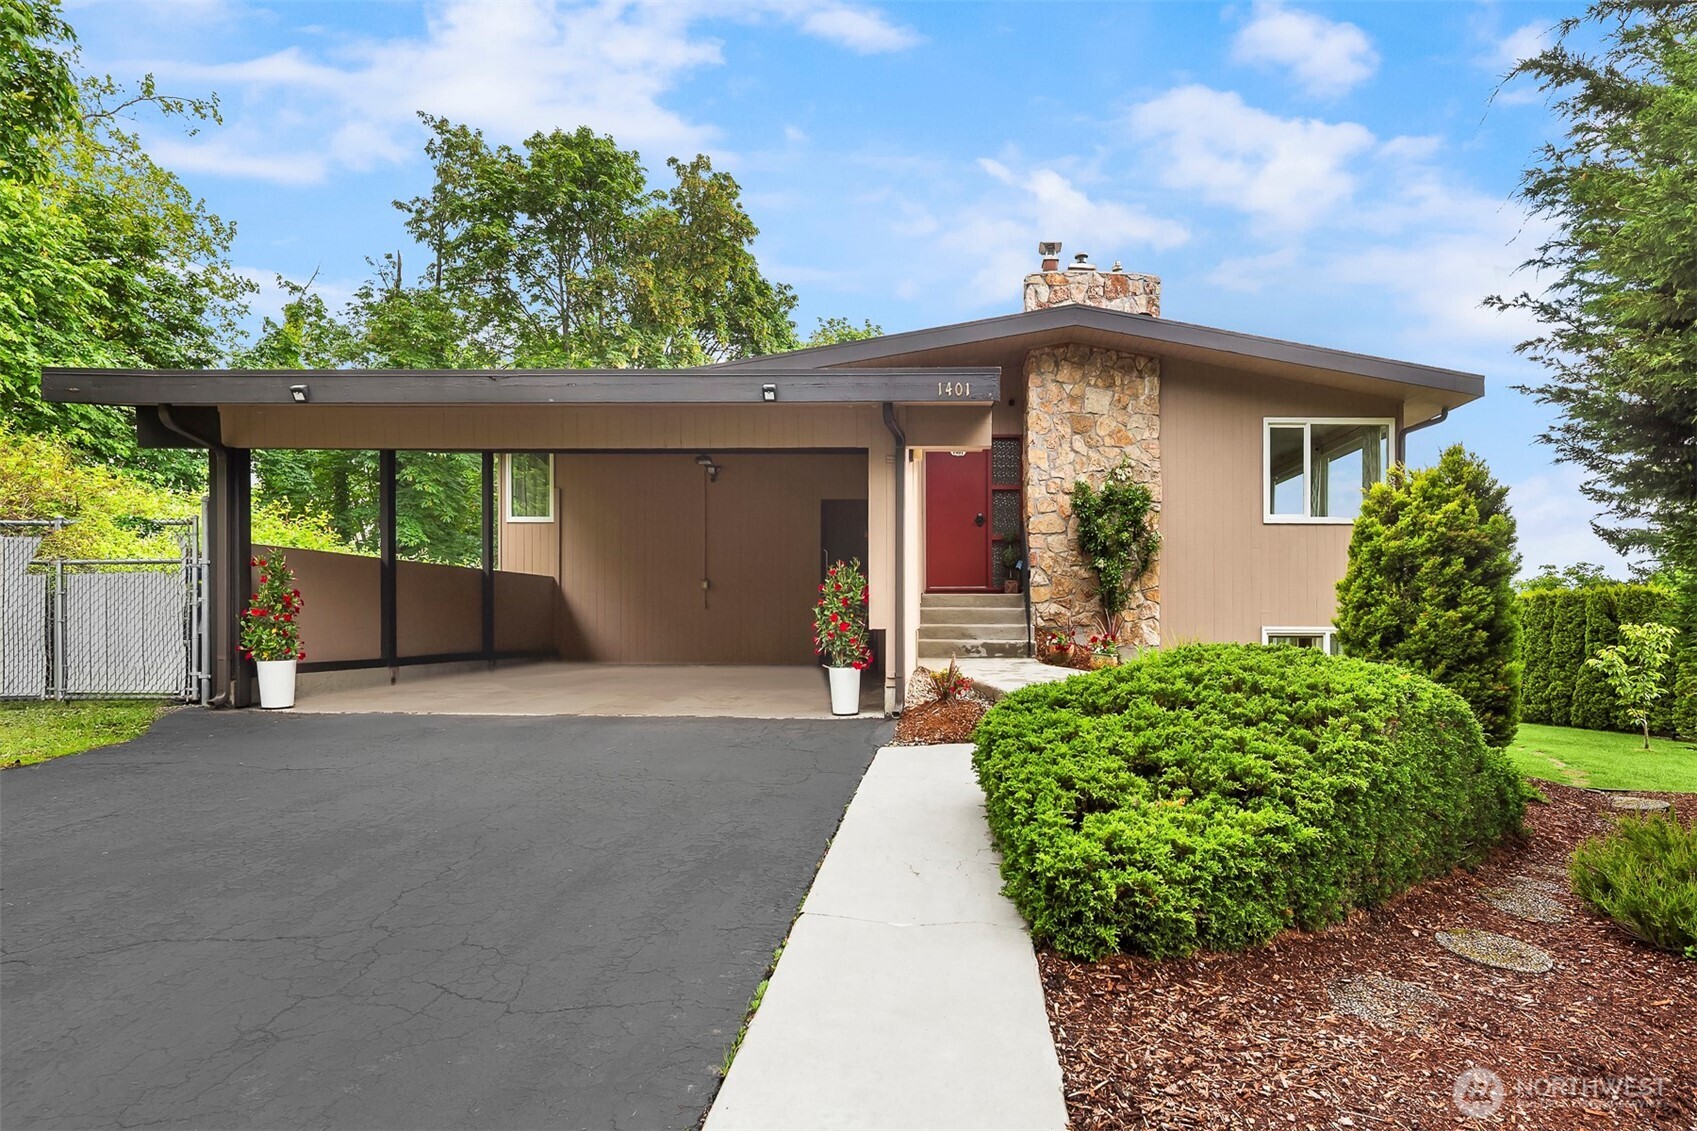
1401 SW 137th Street, Burien, WA 98166
Provided by NWMLS, Keller Williams Realty PS
Provided by NWMLS, Keller Williams Realty PS
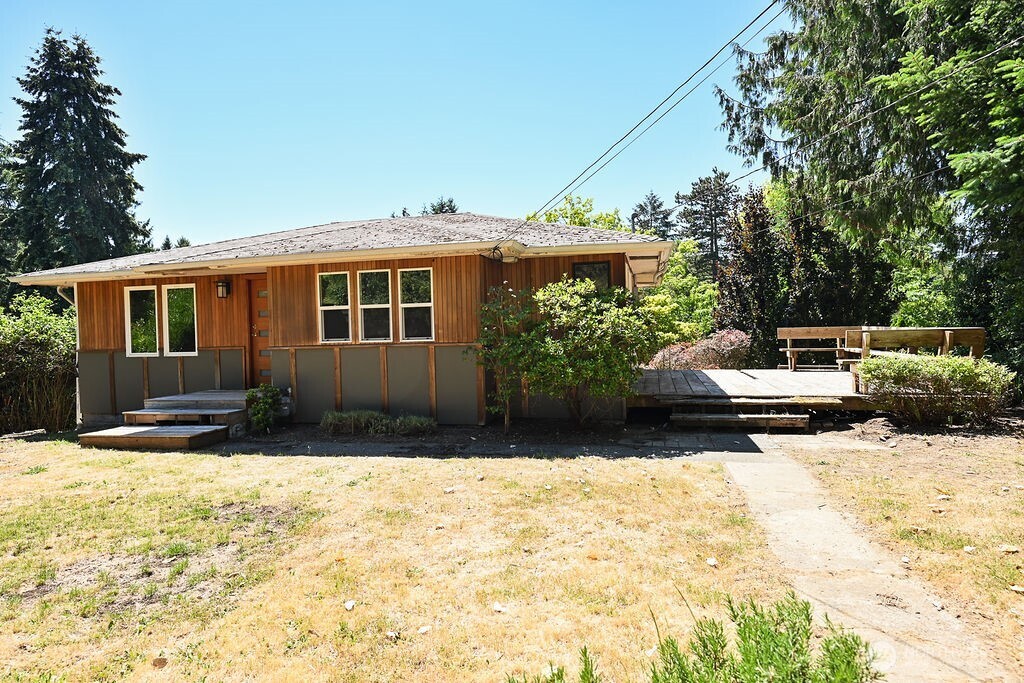
14323 12th Avenue SW, Burien, WA 98166
Provided by NWMLS, John L Scott RE West Seattle
Provided by NWMLS, John L Scott RE West Seattle
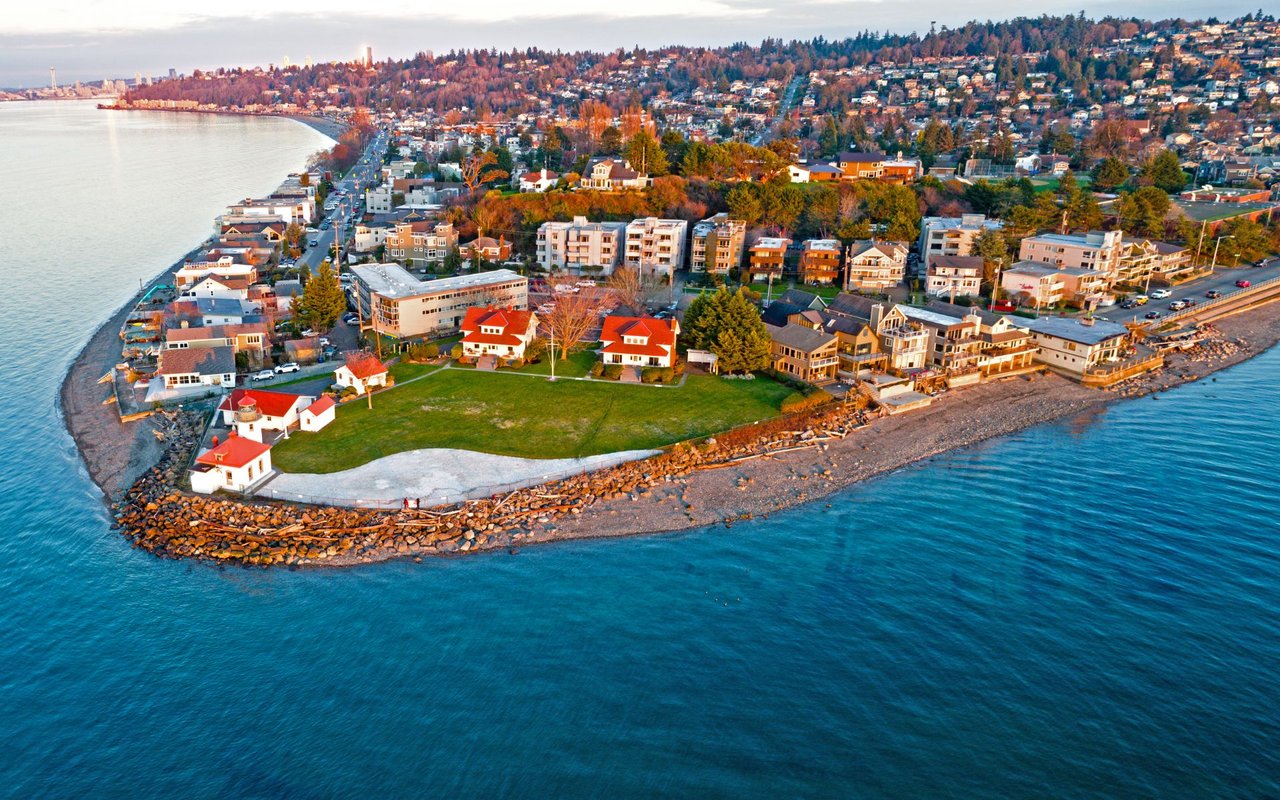
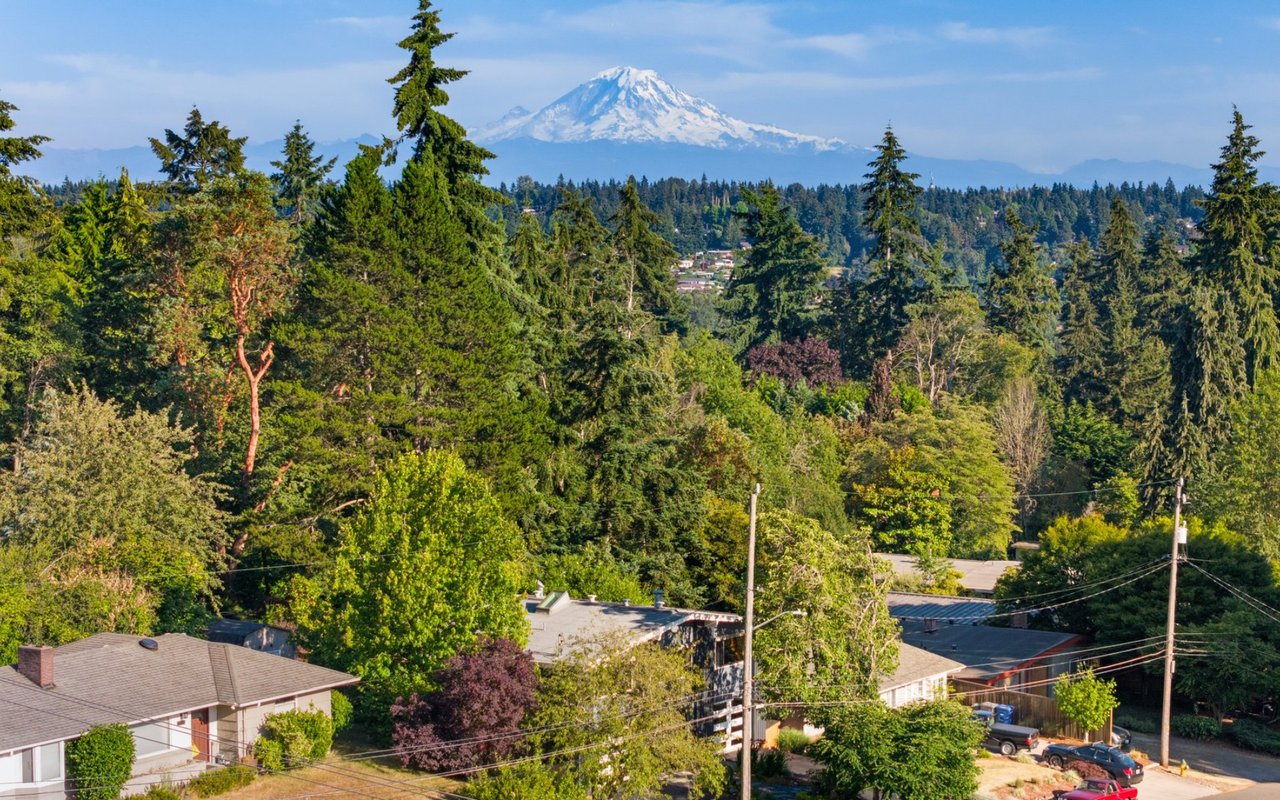
2,743 people live in Seahurst, where the median age is 42 and the average individual income is $55,653. Data provided by the U.S. Census Bureau.
Total Population
Median Age
Population Density
Average individual Income
There's plenty to do around Seahurst, including shopping, dining, nightlife, parks, and more. Data provided by Walk Score and Yelp.
Explore popular things to do in the area, including WUHA Ethiopian-American Cuisine, Bacovino, and Din Tai Fung.
| Name | Category | Distance | Reviews |
Ratings by
Yelp
|
|---|---|---|---|---|
| Dining | 3.56 miles | 8 reviews | 5/5 stars | |
| Dining · $$ | 3.53 miles | 30 reviews | 4.9/5 stars | |
| Dining | 4.71 miles | 5 reviews | 4.8/5 stars | |
| Active | 1.45 miles | 5 reviews | 5/5 stars | |
|
|
||||
|
|
||||
|
|
||||
|
|
||||
|
|
||||
|
|
Seahurst has 1,037 households, with an average household size of 3. Data provided by the U.S. Census Bureau. Here’s what the people living in Seahurst do for work — and how long it takes them to get there. Data provided by the U.S. Census Bureau. 2,743 people call Seahurst home. The population density is 5,065 and the largest age group is Data provided by the U.S. Census Bureau.
Total Population
Population Density Population Density This is the number of people per square mile in a neighborhood.
Median Age
Men vs Women
Population by Age Group
0-9 Years
10-17 Years
18-24 Years
25-64 Years
65-74 Years
75+ Years
Education Level
Total Households
Average Household Size
Average individual Income
Households with Children
With Children:
Without Children:
Blue vs White Collar Workers
Blue Collar:
White Collar:
837 N 34th St Ste 100
Seattle WA 98103
837 N 34th St Ste 100
Seattle WA 98103